12.2022 Office Talk
Lazy bag for driving accurate marketing
Group Integrated Efficiency and Retail Planning Headquarters / Digital Marketing and Public Relations Team

 In the era of information explosion, consumers receive advertisements and promotional messages from social media, communication software, YouTube videos, etc. every day. How to stand out from so many messages has become an important topic in marketing. In order to strengthen the relevant knowledge of the retail marketing colleagues of the Far Eastern Group, the Group's Integrated Efficiency and Retail Planning Headquarters invited Wu Mengxun, the chief data application consultant of the MarTech marketing technology team "Aiku Smart", to assist in the implementation guidance in the workshop.
COVID - 19) has accelerated the digital transformation of enterprises and the transformation of marketing methods. In the book "Marketing 5.0", Kotler, the father of marketing, proposed to solve the current marketing dilemma with five elements, including three core applications (predictive marketing, scenario marketing, and enhanced marketing) and two major efforts (data marketing and agile marketing). Among them, the core application is based on two major efforts, and "data marketing", one of the two foundations, is to collect internal and external data, analyze Big Data, and establish a data ecosystem to promote the optimization of marketing decisions, which is also the primary principle of marketing 5.0 - all decisions must have enough data in hand. In other words, data driven marketing has become a prominent learning. The most important marketing foundation is to spend resources on cutting edge, learn data analysis, and do a good job in accurate marketing.
Basic process of data analysis
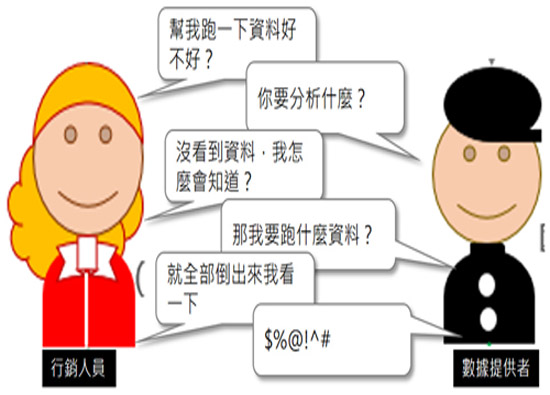
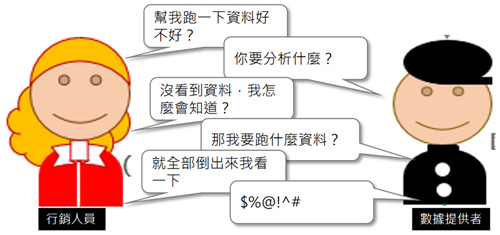
 As a marketing person, do you feel familiar with the scene in the picture? Do you begin to doubt your life because of the need to revise back and forth?
In order to make the work more smooth and avoid harming the harmony between departments, it is recommended to improve the situation according to the following process.
1. Problem setting: When shooting, there should be a clear goal. Once there is a goal, list the relevant problems again. For example, would you like to know how the performance of the Double 11 this year is? The relevant questions are: What are the performance of this year and last year respectively? Number of orders this year and last year? The number of visitors this year and last year... etc.
2. Query: After receiving the data, make a report through query to find out the corresponding answer
3. Output result: the result found through query. For example, compared with last year, the performance of Double 11 this year was the same, the number of visitors increased, the number of visitors decreased, and the number of visitors decreased was mostly less than 25 years old.
4. Decision application: propose corresponding plans or formulate strategies based on the output results. For example, should we care about users under 25? Or should we find ways to attract more mature customers? If you decide to retain young customers, first check whether the data at hand is sufficient for analysis. If you need additional information, go back to the first step and find out the reason for the loss of young customers.
Effective mass communication with member tags
"Member tag" is an adjective describing the characteristics of the member. It usually comes from the results of the actions accumulated by the member in the database and refined by algorithms; "Focus communication" refers to different communication according to consumers' labels, replacing the previous practice of delivering the same lines to all consumers. Therefore, it is important to plan a suitable label. However, before starting to plan labels, you should first clarify the application scenarios. It is recommended to clarify them in the way of Why, What and How.
 Label planning can be classified according to the following conditions:
1. Demography: including gender, age, income, activity area and education level. Most of these will not change. They can also be called "static labels".
2. Consumption frequency: for example, if the annual consumption exceeds 200000 NTD, it can be defined as VIP; If there is no consumption in three years, it can be marked as lost customers. Because these labels will change according to personal consumption habits, they are also called "dynamic labels".
3. Hobbies: broadly divided into entertainment preferences, life preferences, cultural preferences, personal feelings, consumer psychology and other categories. Such tags are not filled in by members themselves, but are inferred from the behavior data of members, so they can be called "predictive tags". For example, members who often come to buy coffee at night can be labeled as "nocturnal members".
Use data chart to assist analysis
When the data is reorganized through analysis, it is presented in the form of a chart, which can speed up insight analysis. However, how to make a chart that can be seen at a glance requires long-term training and sufficient experience points to greatly improve efficiency. In the initial stage, it is suggested to use multiple presentation methods at the same time, and then select the best chart from them.
Example 1: When checking the number of new members added each month and the repurchase status of the current month, it is easier to see that since August, the number of new members has increased, but the number of repurchases has not increased. We can review whether the acquisition method of new members meets the target audience. If the customer group is correct but the repurchase rate is not high, further explore the reasons.
 Example 2: Compare the consumer evaluation of the first and second generation of goods after the revision. If there is only a single commodity, the pie chart Figure 3 can be used, but when it is necessary to compare the two, Figure 4 is easier to see the difference.
Precise marketing realizes data
According to the research of Inc. Magazine, the cost of developing new customers is 5-10 times higher than the cost of implementing "re marketing" to attract repurchase customers. It is suggested to use "data analysis" to define the current situation of the target market, analyze the audience profile and needs, and then screen out more motivated and accurate potential audiences. The past aimless and mass advertising marketing method should be changed to target potential users who are "small in number but highly motivated", so as to maximize the benefits of limited marketing resources. In the digital era of fierce competition and information explosion, whether it is B2C or B2B industry, targeting customers and precise marketing is the only way to efficiently convert potential customers into revenue.


